
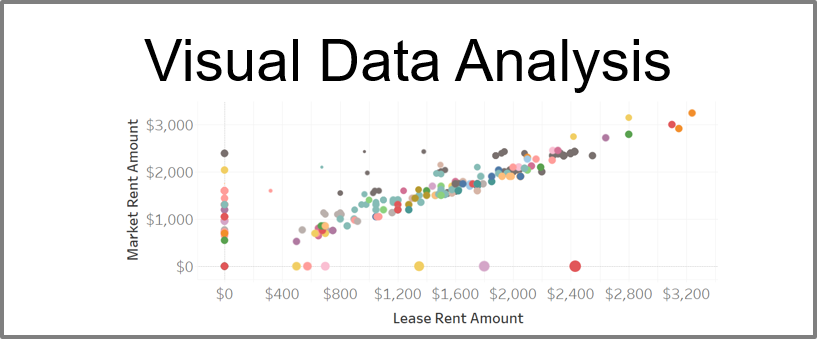
Visual Data Analysis
You property management software has a ton of pre-built reports, and almost all of them consist of rows and columns. Most of us are used to these reports, and since this is all we get, we accept them. What if you had the option to do visual data analysis of your...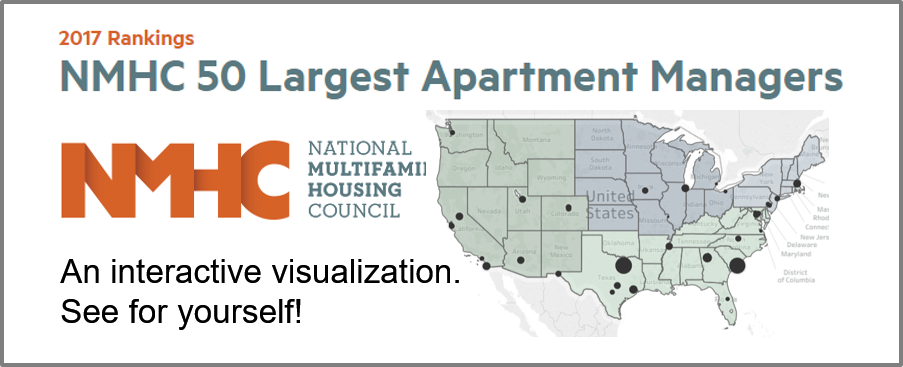
The NMHC Top 50 Managers List (2017)
The National Multifamily Housing Council released its 2017 NMHC Top 50 Lists this week. In addition to publishing the lists, NMHC also provided a downloadable Excel file of the data. I took the data from the 2015, 2016, and 2017 lists and created this visualization in...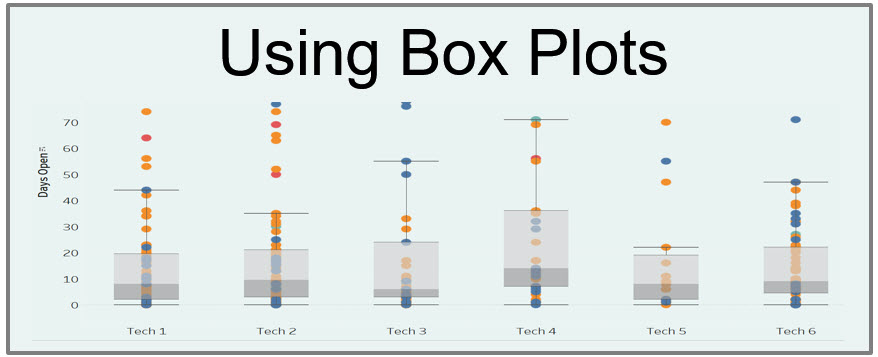
What is a Box Plot?
This post is related to the discussion on how we used analytics to improve maintenance service processes for a property management company. I am going to introduce the box plot and describe when it will be useful to display on your property management dashboard. You...
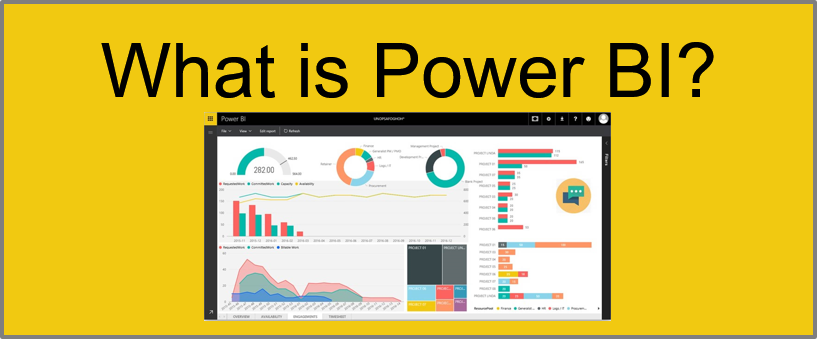
Klipfolio is right for monitoring metrics
Note: I don’t derive any financial incentive from Klipfolio for writing about them here. I recommend Klipfolio as a cloud dashboard solution for many companies. I have used it before and have recommended it to clients in the past. Allan Wille, their CEO, has...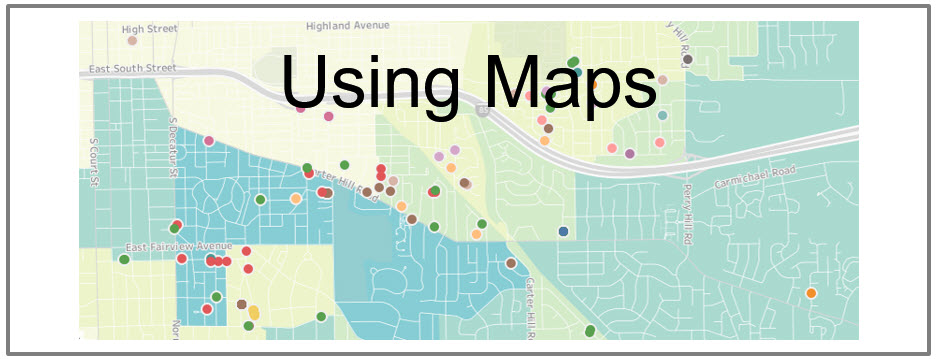
Maps and Real Estate Analytics
See this demo of using maps for understanding the performance of the properties in your...Download the Metrics Handbook
The Property Management Metrics Handbook is a source for metrics you might want to use for measuring the performance of your business.
