Power BI is a data visualization product offered by Microsoft. It can be used for presenting financial and other key metrics of your properties to your investors, executives and property managers. I have built Power BI dashboards for property management clients with good success.
Are you creating charts in Excel, pasting them into PowerPoint presentations and emailing the files to investors and executives? Many companies do this, and there are several deficiencies in this approach:
- Refreshing the charts with the latest data is time consuming
- It is not possible to “interact” with the data by applying filters and drilling down
- Only people with access to the file can view the charts
- Last-minute updates to the data require reproducing the charts, pasting them, and emailing the files.
- Emailing files leads to clutter and sometimes not everyone is looking at the same version of the data.
If these problems apply to you, they are good reasons to consider Power BI dashboards for property management reporting and analysis. These problems have been known for a long time, and in the last decade, several browser-based data visualization tools have hit the market. Microsoft’s product in this category is called Power BI. The “BI” stands for Business Intelligence.
Below is a one-minute video from Microsoft that provides an overview. Seeing Power BI in action is more useful than reading about it ;).
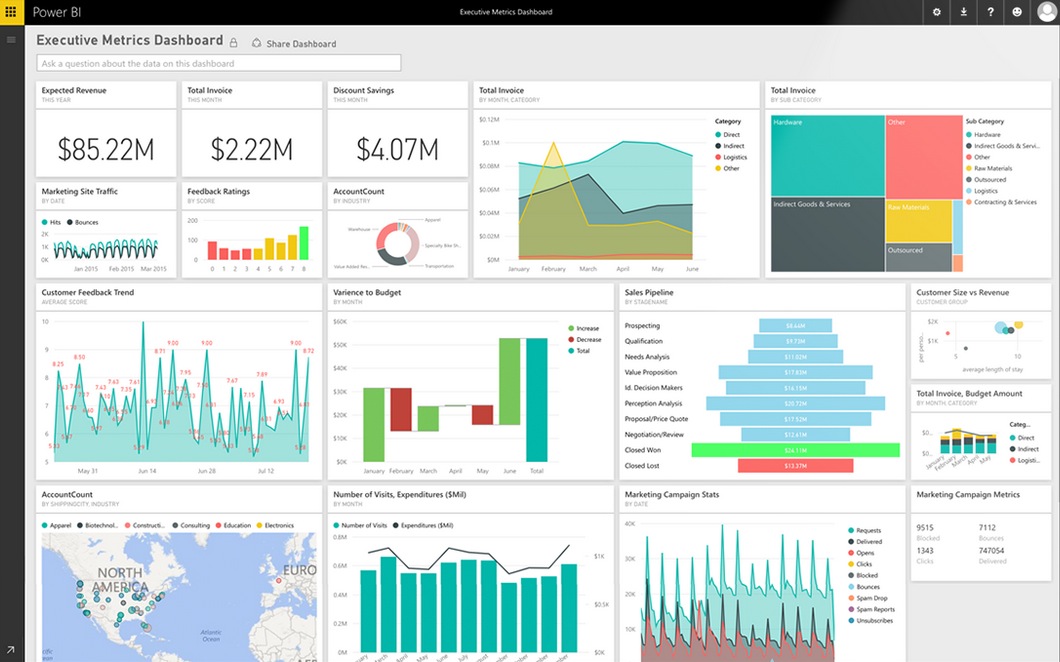
The image below provides an example of the visualizations available in PowerBI (this is not my dashboard). I am using it here to because it has a wide variety of widgets to illustrate the many ways data can be presented. My Rent Viewer product offers property management KPI dashboards built using Power BI and Tableau.