
The National Multifamily Housing Council released its 2017 NMHC Top 50 Lists this week. In addition to publishing the lists, NMHC also provided a downloadable Excel file of the data. I took the data from the 2015, 2016, and 2017 lists and created this visualization in Tableau. The visualization is posted on Tableau Public.
[wpbuttons ids=”2_2″]
I built the visualization out of curiosity. Some of the questions I had were:
- Who are the big players?
- Who had the biggest increases in units?
- Did the overall number of units go up or down?
- Who dropped out of the rankings?
- Does the 80-20 rule apply to this list?
- Are there differences across different parts of the country (South, Midwest etc.)?
NMHC Top 50 Workbook Content
As of this post, the workbook contains these 5 tabs:
0 – Overview: An overview of the workbook as well as a link to the NMHC page where the Top 50 list was posted.
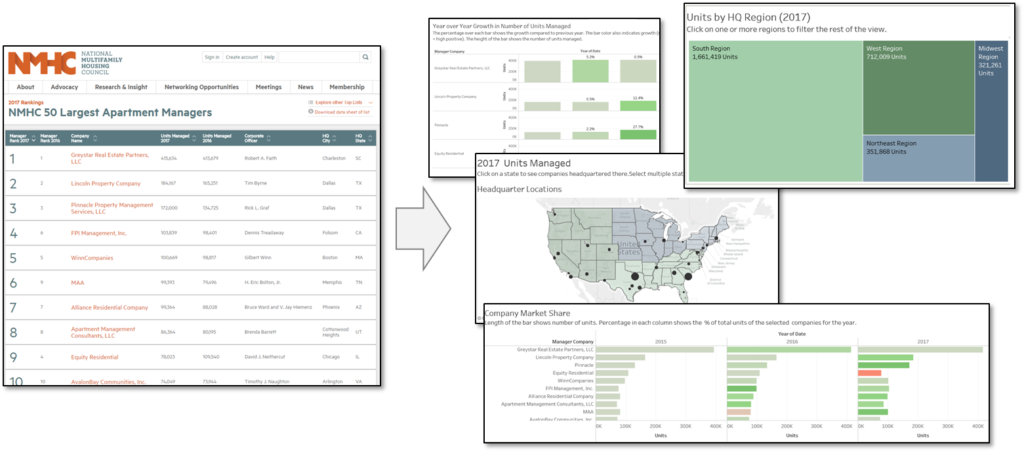
1 – Interactive Map: This shows the headquarter location of each of the management companies in the Top 50 list. The size of the circle represents the number of units managed. Below the map is a list of the companies.
2 – Rank, Units, Market Share: This is a tabular list showing a comparison of 2015, 2016 and 2017 numbers for the companies on the Top 50 list. Some companies have fallen off the list (or changed their names), and others have been added.
3 – Regional Analysis: This shows the number of units managed by region (note: Region is not the location of the units! It is simply the location of the company headquarters. If I get my hands on data showing where units are located, I’ll publish another visualization). The companies in the region are also shown.
4 – Year over Year Growth: This shows the companies that had increases and decreases in the number of units managed. It also illustrates how we can use text, color and magnitude to highlight key information.
Data Sources
The data comes from two sources: NMHC (National Multifamily Housing Council), and the U.S.Census Bureau.
- The NMHC releases the “50 Largest” rankings and these can be downloaded as an Excel file.
- The Census Bureau data is simply to define the geographic Regions and Divisions. These could be analogous to territories or regions within your property management company. Download the Excel file here
