by Saad Shah | May 21, 2017 | 4. Presentation Tools
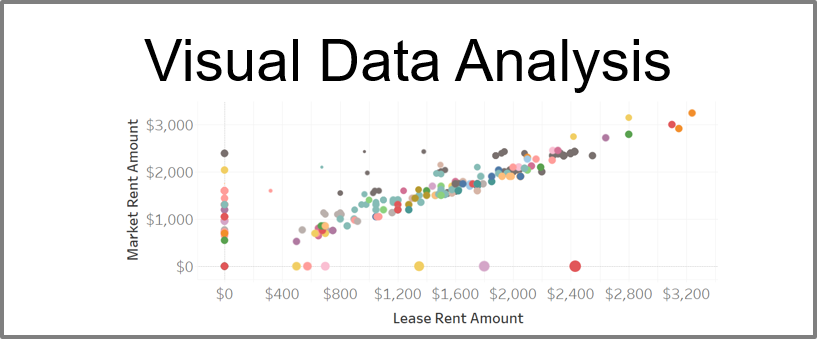
You property management software has a ton of pre-built reports, and almost all of them consist of rows and columns. Most of us are used to these reports, and since this is all we get, we accept them. What if you had the option to do visual data analysis of your...

by Saad Shah | Apr 15, 2017 | 4. Presentation Tools, 6. Results, Case Studies, Demo
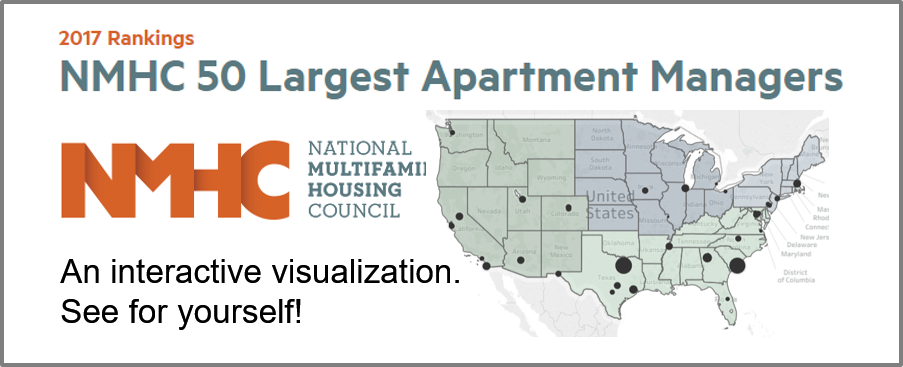
The National Multifamily Housing Council released its 2017 NMHC Top 50 Lists this week. In addition to publishing the lists, NMHC also provided a downloadable Excel file of the data. I took the data from the 2015, 2016, and 2017 lists and created this visualization in...


