
The Pareto Principle is more commonly known as the 80/20 rule. Property management companies can apply this rule to focus their time and money on the things that matter. In this post I will illustrate the 80/20 rule in property management with data on maintenance service tickets.
If you are undertaking process improvement projects in your property operations, start by seeing how the 80/20 rule applies. Then focus like a laser on understanding the root causes and creating lasting improvements.
What is the 80/20 Rule?
The 80/20 rule says that in many situations, 20 percent of the causes produce 80 percent of the results. I’ll spare the statistical definitions, and provide some examples below.
The 80/20 Rule in Property Management
Let’s see if the 80/20 Rule applies to your property management business:
- Do 20% of your tenants account for 80% of the complaints?
- Do 20% of leasing agents close 80% of new leases?
- Do 20% of the tenants account for 80% of the late rent payments?
- Do 20% of the units account for 80% of the maintenance expenses?
- Do 20% of service tickets account for 80% of the cost?
- Are 80% of the positive reviews and compliments directed at 20% of the staff members?
- In your overall portfolio, are 20% of the properties generating 80% of the profit?
Wouldn’t it make sense to understand what is common about the 20% of the tenants, or 20% of the maintenance issues that are having the most impact? Once you understand the patterns and common characteristics among them, you will know what actions to avoid or do more of.
Using Data for Insights
For some property management executives, the 80/20 is observed through common sense and intuition. The rest of us can look at data to arrive at insights.
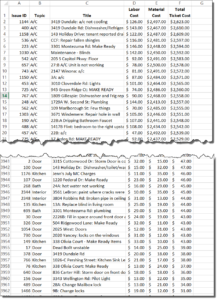
For example, let’s look at service tickets. Do you have data that shows how much labor and material expense was consumed for each ticket? Load the data into an Excel sheet (columns: Ticket #, Description, Issue Type, Total Cost). Sort the list in descending order by Total Cost.
Select the top 20% of the tickets and see how much of the total cost they account for.
Example of 80/20 Rule in Property Management
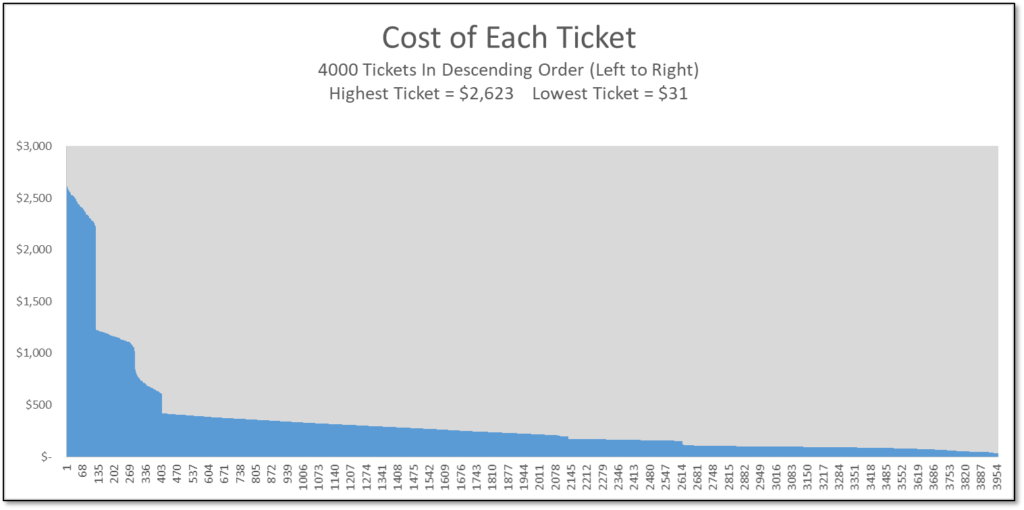
In the example below, I took a list of 4,000 service tickets and sorted them in descending order. The resulting chart has several “steps” where there is a big change in the cost of a ticket. Do you see how the first 100 or so tickets have a very high cost? Then there is a second tier ranging from $1,300/ticket down to $400 per ticket. After that, there is a “long tail” starting at about the 400th ticket.
While this data does not conform strictly to the 80/20 rule, it gives you a clear picture that there is a small number of tickets accounting for a large portion of the total cost.
In order to reduce my total maintenance expenses, I would look at the top tier of tickets and see what they have in common. What is the root cause of these tickets and how can I make structural changes to reduce these? If reduction is not possible, I at least need to be able to predict them and budget for them properly so that they don’t disrupt my business.
Summary
In order to apply the 80/20 rule in property management, look at the data. Sort the incidents from largest to smallest, and the data will reveal the tiers or groups of incidents that account for most of the outcomes (expenses, revenue, complaints, hours wasted etc.). We looked at an example of how we can graphically identify the service tickets that should be analyzed further.
- post 4026
