The content on this blog has been categorized according to the diagram below. The diagram shows the sequence of how data gets created, organized and consumed to produce business results.
These numbers will help you find the content you are interested in. The category descriptions are below the diagram.
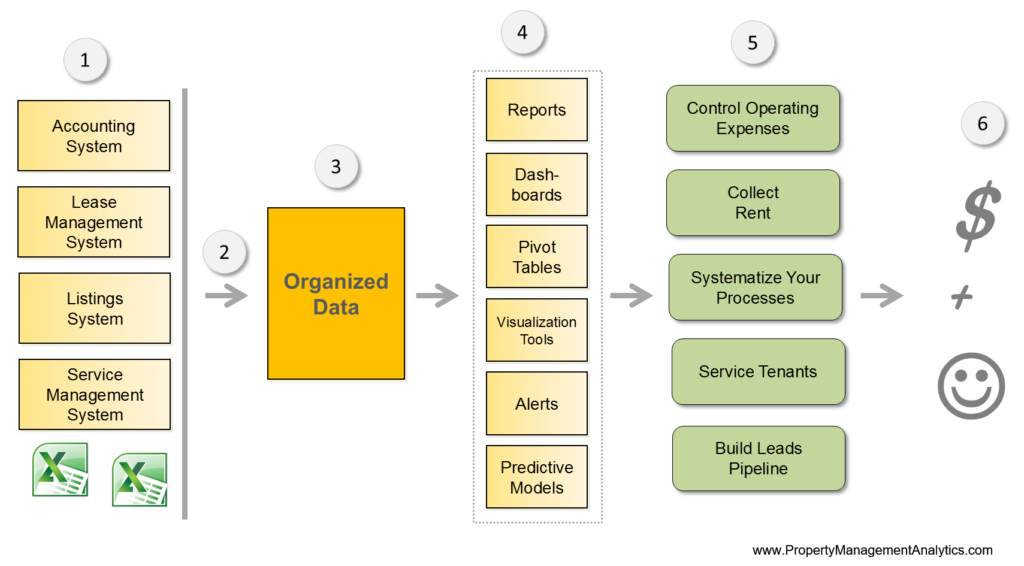
1: Source Systems
Systems used to run a property management business. This is where data is created. Examples are Rent Manager, Yardi, MRI or related systems such as PM Toolbelt, Show Mojo etc.
2: Data Extraction
Topics related to the import / export of data from business systems into a reporting database or other destination.
3: Reporting Database
Topics related compiling, cleaning and organizing the data so that it can be analyzed and reported on.
4: Presentation Tools
Topics for presenting the data. Includes reports, dashboards, predictive models and alerts.
5: Business Processes
Topics related to the processes for operating a property management business. Processes are measured and improved through the use of analytics.
6: Results, Case Studies
Topics related to success stories, uses and initiatives related to analytics. The value of analytics is covered in this category.
